
Learner story 01
📊 Practical Industry Curriculum
🌐 Online Batches Across India
Data Analyst Course in Bangalore: Learn Practical Analytics Skills at SV CurioTech
Open any job portal in Bengaluru and you will see the same pattern. Banks, e-commerce companies, IT services firms, startups and hospitals all need people who can look at a spreadsheet full of numbers and say what it means. That is what a data analyst does, and it is one of the more approachable entry points into the technology industry.
If you are a final-year student wondering what to learn before graduation, a fresher whose degree did not lead anywhere useful, or a working professional tired of building reports by hand, our data analyst course in Bangalore is built for you. You do not need to be a programmer to begin. You need curiosity, a willingness to practice, and a reason to learn.
Course Fee
₹30,000
Transparent, all-inclusive
Duration
3 Months
Weekday & Weekend
Learning Mode
100% Online
Live interactive sessions
Quick Enrollment Enquiry
Enquire for Next Batch
Speak directly with an SV CurioTech learning advisor about batch timings, syllabus, and enrollment.
About SV CurioTech
Innovating Education Through Technology
SV CurioTech's data analytics training focuses on the tools and methods used in real business settings. The idea is simple: you learn how data is collected, organized, analyzed and presented for decision-making, and you practice each step on realistic examples instead of only reading about it.
Our Core Approach:
Learn tools used in real business environments, apply them on projects, and get guidance throughout. We train learners across Bangalore, Karnataka, and all over India in Data Analytics and enterprise technologies.
You can speak to our team before you commit, ask about the syllabus and batch timings, and decide whether the course fits your goals. There is no pressure to enrol on the first call.
- No coding prerequisites: Starts from foundational Excel and advances steadily.
- Interactive live sessions: Clear your doubts in real-time with experienced instructors.
- All-India access: Join from Bangalore or anywhere in India via flexible online batches.
Course Overview At A Glance
Designed specifically to help college students, freshers, and working professionals transition into data and business reporting roles.
3 Months
Structured Curriculum
₹30,000
All-Inclusive Fee
6 Tools
Excel, SQL, Power BI, Tableau, Python, Stats
7+ Projects
Real Business Domains
Market Perspective
Why Learn Data Analytics Now?
Every business makes decisions, and more of them are expected to be backed by data. Which product sells best in which region? Why did customer complaints rise last month? Where is the marketing budget going to be wasted? Someone must collect the data, clean it, analyze it and present it in a way that managers can act on.
Bengaluru's Analytics Ecosystem
The city is home to a large mix of IT services companies, product firms, startups and finance and e-commerce teams, so you will find analytics talked about everywhere, from meetups to office canteens.
High Business Impact
From forecasting sales to identifying operational bottlenecks, modern organizations rely heavily on data professionals who can interpret numbers accurately and communicate actionable insights.
Approachable Entry Point
You do not need an advanced engineering degree or years of programming experience. Strong curiosity, structured thinking, and mastery of Excel, SQL, and BI tools give you an effective launchpad.
What You Will Be Able to Do
By the end of this 3-month program, you will possess tangible, practical capabilities:
✔
Organize and clean messy data so that it is ready for dependable analysis
✔
Write SQL queries to pull, filter, sort and join data directly from production databases
✔
Build clear executive reports and interactive dashboards using Power BI and Tableau
✔
Use Python for handling complex datasets, manipulation, and exploratory data analysis
✔
Apply basic statistical thinking to understand real trends versus random variation
✔
Explain your findings in plain language, which is half the job in analytics
Structured Syllabus
What You Will Learn: Course Curriculum
We teach the tools that entry-level and junior analytics roles ask for, organized in a logical order that makes sense for beginners.
Module 01
Microsoft Excel
Excel for Data Analysis
Most analysts begin and end their day in Excel, so we start there. You will work with formulas, data cleaning, analysis and reporting, and learn how to turn raw data into organised, readable summaries.
- Essential & advanced formulas (VLOOKUP, XLOOKUP, INDEX/MATCH)
- Data cleaning, text parsing, and deduplication
- Pivot Tables, Pivot Charts, and summary metrics
- Conditional formatting & building readable executive summaries
Module 02
SQL & Relational DBs
SQL and Databases
Business data lives in databases, not spreadsheets. You will learn queries, filtering, sorting, joins and data management, so you can fetch exactly the data you need instead of waiting for someone else to send it.
- Relational database concepts and schema exploration
- SELECT, WHERE, GROUP BY, HAVING, ORDER BY
- Multi-table INNER, LEFT, RIGHT, and FULL joins
- Subqueries, aggregate calculations, and data filtering
Module 03
Applied Math
Statistics for Analysts
Numbers can mislead. This module builds the statistical understanding needed to read data sensibly, such as knowing what an average hides or when a trend is actually meaningful.
- Descriptive statistics: Mean, Median, Mode, and Outliers
- Variance, standard deviation, and data distributions
- Correlation vs. causation in business contexts
- Identifying misleading metrics and reporting accurate figures
Module 04
Microsoft Power BI
Power BI & Data Visualization
Insight is useless if nobody understands it. In Power BI you will learn to build reports and interactive dashboards, and how to choose visuals that make the point quickly.
- Power Query ETL and data modeling basics
- DAX calculated columns and basic measures
- Interactive filters, slicers, drill-downs, and bookmarks
- Designing clean, decision-ready executive dashboards
Module 05
Python for Analytics
Python for Data Analytics
Python is introduced in the context of data work: concepts useful for analysis and for handling datasets. No advanced programming background is expected.
- Python basics tailored specifically for data handling
- Working with Pandas DataFrames and NumPy arrays
- Handling missing values, filtering, and dataset aggregation
- Exploratory data analysis (EDA) on real-world datasets
Module 06
Tableau Desktop
Tableau Data Visualization
Tableau is widely used by global enterprises for visual discovery and interactive reporting. Learn to connect data, create custom calculated fields, and craft visual stories.
- Connecting to various enterprise data sources
- Creating charts, maps, dual-axis graphs, and trendlines
- Dashboard actions, interactive filters, and parameters
- Storyboarding and presenting analytical findings clearly
Learning Experience
How We Teach
01
Practice Over Theory
Concepts are taught alongside practical activities, so you apply an idea straight after learning it.
02
Trainer Guidance
Support while learning tools and working through exercises—especially when you are stuck at 9 PM on a Tuesday with a broken formula.
03
Flexible Scheduling
Weekday and weekend batches help working professionals and college students fit learning around their routines.
04
Professional Profile Help
Guidance on building your profile properly, including resume preparation, mock interviews, and project walkthroughs.
Hands-on Portfolio
Practical Projects: Learn by Doing
Reading about analytics is easy. Doing it on messy data is where the learning happens. Our practical project work is built around business situations you are likely to meet at work.
Sales & Commercial
Sales Performance Analysis
Evaluate regional sales trends, identify best-selling product categories, and calculate quarterly growth margins from raw transaction logs.
Excel
SQL
Power BI
Customer Success
Customer Data & Churn Analysis
Analyze customer purchasing behavior, segmentation, and early churn indicators to pinpoint where revenue loss occurs.
SQL
Python
Statistics
Human Resources
Employee & HR Analytics
Examine workforce attrition rates, performance reviews, and department headcount distributions to help HR leadership make informed decisions.
Excel
Power BI
Finance & Planning
Financial Reports & Cost Breakdown
Construct automated financial summaries, tracking operational expenses, variance against budget, and department spending patterns.
Excel
SQL
Growth & Acquisition
Marketing Campaign Analysis
Track multi-channel campaign ROI, cost-per-acquisition (CPA), conversion rates, and evaluate where marketing spend delivers the strongest return.
Tableau
Python
E-Commerce & Retail
Product Performance & KPI Dashboard
Build an interactive dashboard enabling managers to drill into inventory turnover, delivery timelines, customer reviews, and profitability.
Power BI
Tableau
SQL
Build Projects You Can Talk About in Interviews
When an interviewer asks, "What have you actually built?", you won't give a vague textbook answer. You will have structured projects to walk through, explaining your queries, data cleaning steps, and business findings.
Student Success
Student Placements & Alumni Gallery
Our learners come from diverse backgrounds and apply their practical data, analytics, and enterprise skills in leading technology and corporate teams. Hover over any card to pause the continuous ticker.
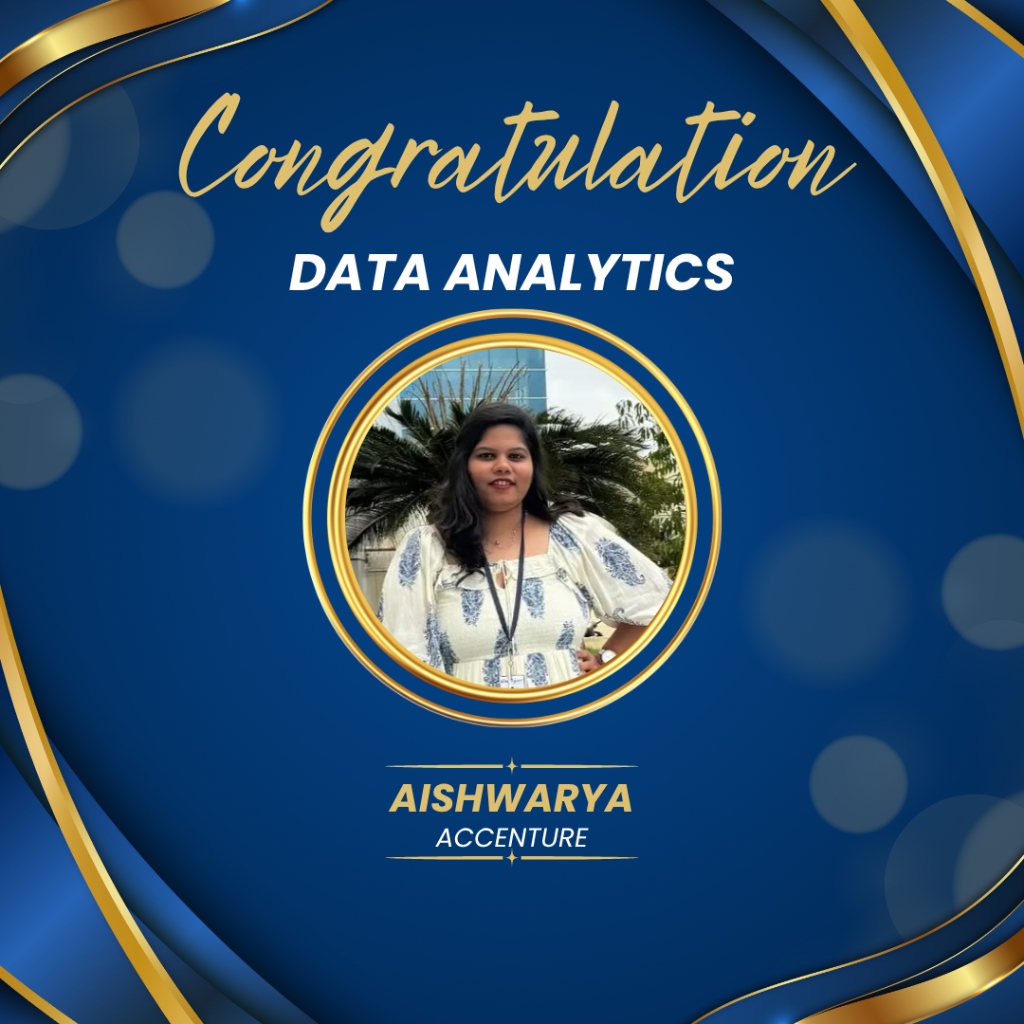
Aishwarya
🏢 Accenture

Pradeep Kumar
🏢 Ikyam Solutions

Nirmal
🏢 Highbar Technocrat

Sivaguru
🏢 Primus Techsystems

Mohan Kumar
🏢 Bosch

Kavitha
🏢 Carelon Company

Anupama
🏢 Accenture

Vikash
🏢 ABB

Sahana
🏢 Truerize IQ Solutions

Karthick
🏢 Neovatic Technologies

Naveen Kumar
🏢 Novel Veritas

Nikitha
🏢 Neovatic Technologies
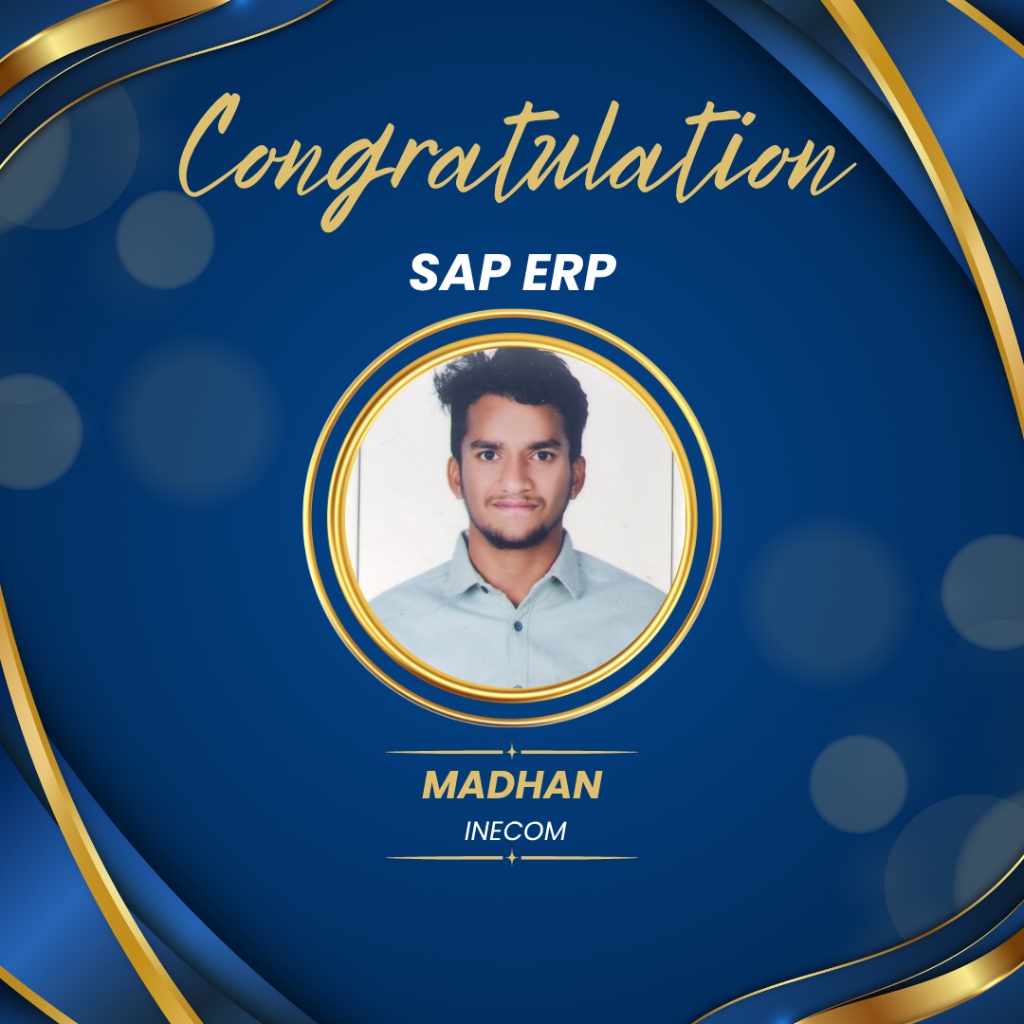
Madhan
🏢 Inecom

Prabhu
🏢 Apsolut

Senthil Kumar
🏢 2i Solutions Group

Siri
🏢 Skysurge Business

Ramesh
🏢 Sapphire Technocrats
Learner Feedback
See the learning experience in action
Explore learner feedback, shared technology-course milestones, and career-readiness context.
Student feedback videos
Learner story 02
Learner story 03
Learner story 04
Learner story 05
Learner feedback from Google
“The practical sessions helped me build confidence.”
Pavitra AngadiSV CurioTech learner“The trainer explained concepts clearly with hands-on examples.”
Swathi LSV CurioTech learner“Practical learning and expert guidance made the class easy to follow.”
Tilak GSV CurioTech learnerTechnology and analytics career context
These organisations represent the broader technology and analytics ecosystem. They are not hiring promises or claims of affiliation.






Industry Credential
Official SV CurioTech Institute Certificate
Upon successful completion of the course syllabus and hands-on capstone projects, you are awarded the official SV CurioTech Institute Certificate. This credential demonstrates your practical capability in data analysis and business reporting to prospective employers.
-
Practical Competence Verified Validates hands-on knowledge in Excel, SQL, Statistics, Power BI, Tableau, and Python.
-
QR Code & Online Verification Each certificate features an official certificate code and instant digital verification on svcuriotech.com.
-
Career & LinkedIn Ready Easily shared on your professional LinkedIn profile, resume, and job applications for hiring teams.
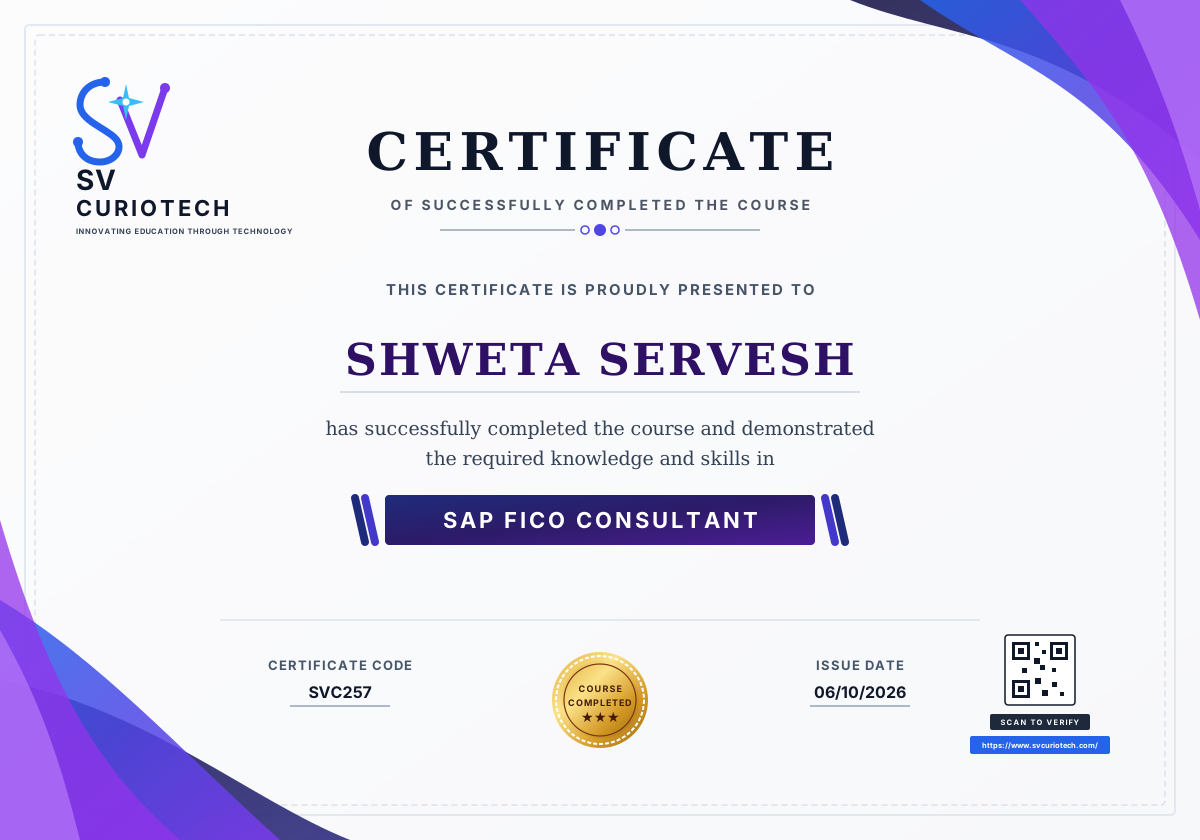
Certificate Code: SVC257
✔ Scan to Verify Online
Status: Course Completed ★★★
Career Horizons
Career Paths After Learning Data Analytics
Building practical analytics skills can help you explore entry-level roles involving data, reporting, and business intelligence.
Data Analyst / Junior Analyst
Business Analyst
Reporting Analyst
MIS Analyst
Business Intelligence Analyst
Power BI Developer
Tableau Specialist
Data Reporting Specialist
Our Honest Career Philosophy
No training institute can promise you a job, a salary or a particular company, and we do not. Outcomes depend on your effort, your portfolio, your communication and the job market at the time. What we offer is structured learning, practical project work and guidance on presenting yourself well—including resume preparation, mock interviews, and practice in explaining your projects clearly to technical recruiters.
Got Questions?
Frequently Asked Questions
Clear, transparent answers to help you evaluate if our practical Data Analytics training fits your goals.
The course is open to college students, fresh graduates, working professionals, job seekers and career changers. Engineering, commerce and management graduates are all welcome. If you have basic computer familiarity and an interest in working with numbers, you are eligible to join.
No. Advanced programming experience is not required to learn the fundamentals. The course starts with Excel and builds up gradually to SQL, Power BI, Tableau, and Python. We teach Python strictly in the context of data manipulation, making it beginner-friendly.
The data analytics course duration is 3 months. Weekday and weekend batches with flexible timings are available so that students and working professionals can both manage it comfortably.
The course fee is ₹30,000 for the entire 3-month program. We maintain transparent pricing with no hidden charges. Contact us to learn about batch schedules and payment arrangements.
You will master 6 core tools and disciplines: Microsoft Excel, SQL & Relational Databases, Statistics for Analysts, Microsoft Power BI, Tableau Data Visualization, and Python for Data Analytics.
Yes. Practical projects are central to the training, covering areas such as sales performance, customer data analysis, employee attrition, financial reporting, marketing campaign ROI, and executive business dashboards.
Yes. We offer both weekday and weekend batches with flexible timings. Training is conducted 100% online, making it accessible to learners across Bangalore, Karnataka, and nationwide across India.
Yes. The flexible schedule, weekend batch options, and beginner-friendly progression are designed specifically with working professionals in mind who want to transition from manual spreadsheet reporting to automated business analytics.
We cannot guarantee a job, and you should be cautious of anyone who does. We help with resume preparation, mock interviews, project explanation practice and career guidance, but final outcomes depend on your consistent effort, project portfolio, and the current market.
Yes. Many successful analysts come from commerce, management, finance, and arts backgrounds. Strong spreadsheet skills, logical thinking, curiosity about business numbers, and clear communication count for a great deal in analytics roles.